by Chris Walker, Landscape Architect.
We started with a map that was presented by Morrison & Foerster, the lawyers for Blake Griggs Properties, the developers who are proposing to build 260 apartments and 28,000 square feet of retail on the West Berkeley Shellmound Landmark site at 1900 4th Street in Berkeley. In the lawyer’s letter defending the Draft Environmental Impact Report, the following map appears as Exhibit C:

This map shows two mounds on either side of the Spenger’s parking lot (the development site is in orange, the two mounds are indicated as hatched circles to the north). What is unique about this map is that it has historical line work superimposed on a modern street grid. This map was created by the U.S. Geological Survey (USGS) in 1957.
In the legend of the 1957 U.S. Geological Survey map, the boundaries of the former shorelines, the streams, the tidal flats, and the Indian shellmounds, are indicated as being referenced from an entirely different map from 1856:

In short, everything that we were interested in, had been superimposed onto this new map from another, older, unpublished map. Under the dotted line symbol above is the name of this unpublished map.
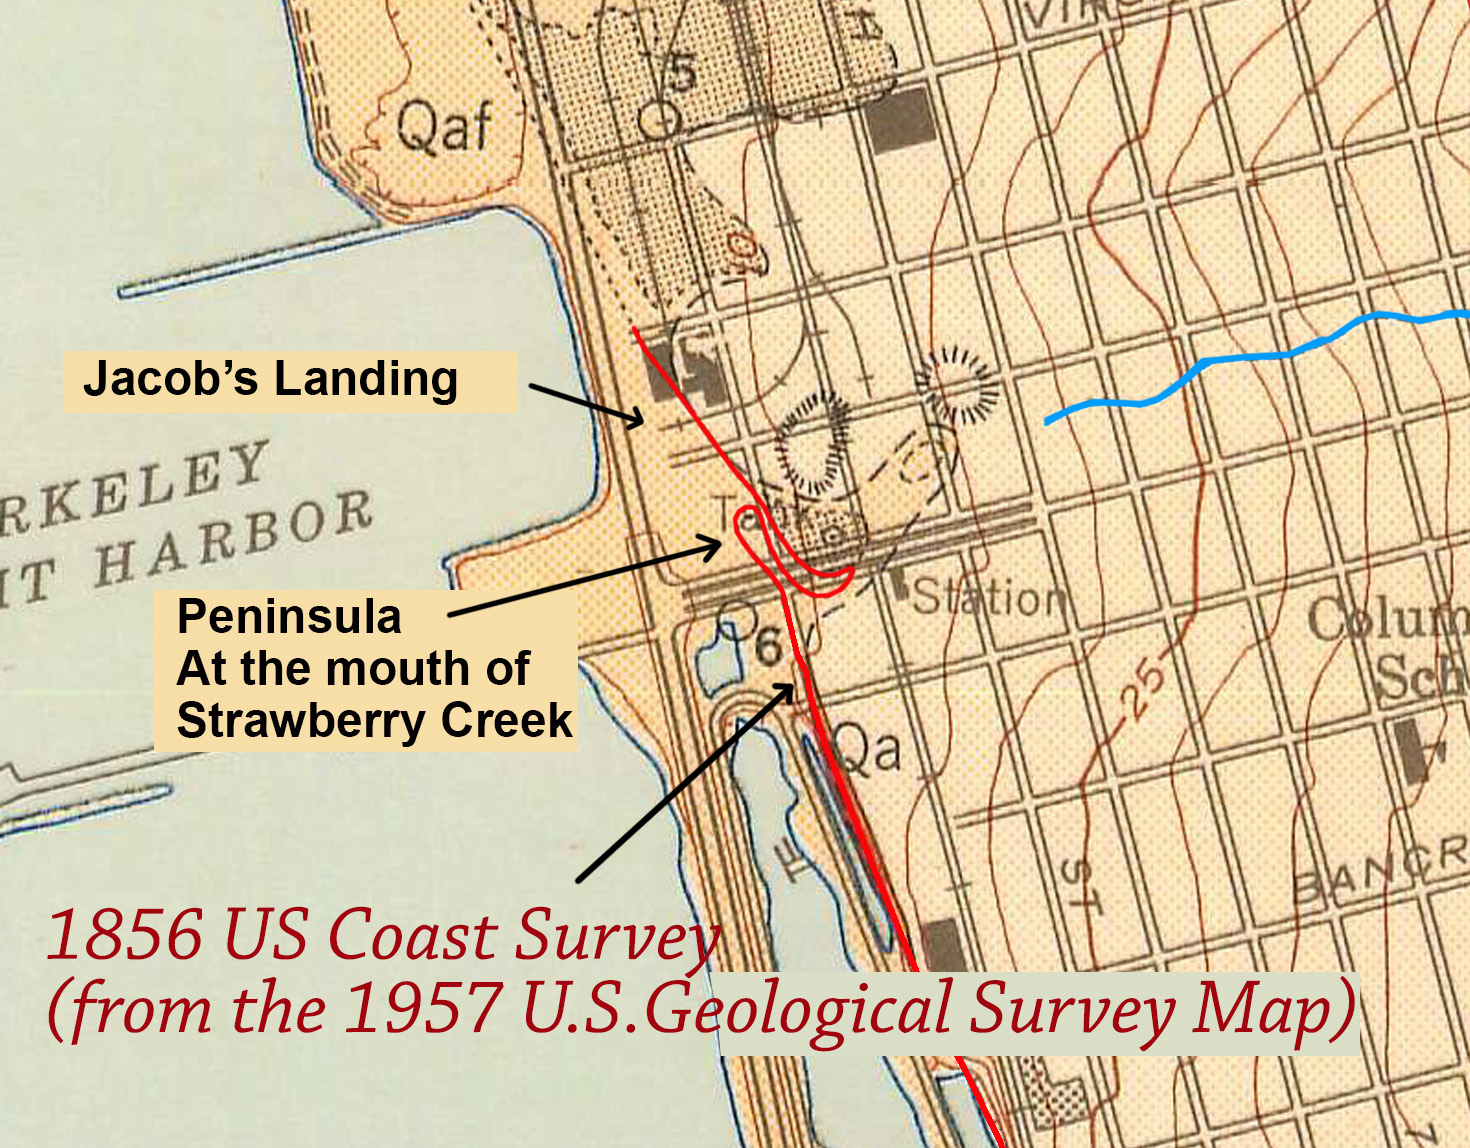
I found a clean digital copy of the U. S. Coast and Geodetic Survey Plane Table Sheet XXV, 1856 map at the National Oceanic and Atmospheric Administration (NOAA) historic maps library. The technical name for this map is T-sheet 591 (“T “for Topographic):

We had not anticipated the amount of detail we would find in the 1856 US Coast Survey source map. The shellmounds actually had topographic lines on them, and they were surrounded by a riparian landscape along Strawberry Creek. Elevation data was written in pencil for most of the early buildings:

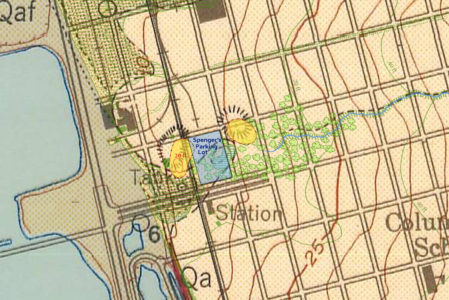
I immediately set about reinserting this new source map back into the U.S. Geological Survey map from 1957 and this is what I got:

As you can see, the mounds (in yellow) tell a different story.
So, here is the process I followed to create the 15-map sequence of the history of this site:
I assumed that accuracy for superimposing these maps would be based on corroborating maps, and a wide set of reference points to register the maps to one another. The farther these points are away from each other, the more accurate the rotational and spatial registration would be. In this case, I registered landmarks from Fleming Point in the north, to the the Emeryville Shellmound in the south.
I used three frames of reference as lineup anchors,
- The base stations and landmarks that the surveyors and map makers used in 1856.
- The coastline, creeks and roads.
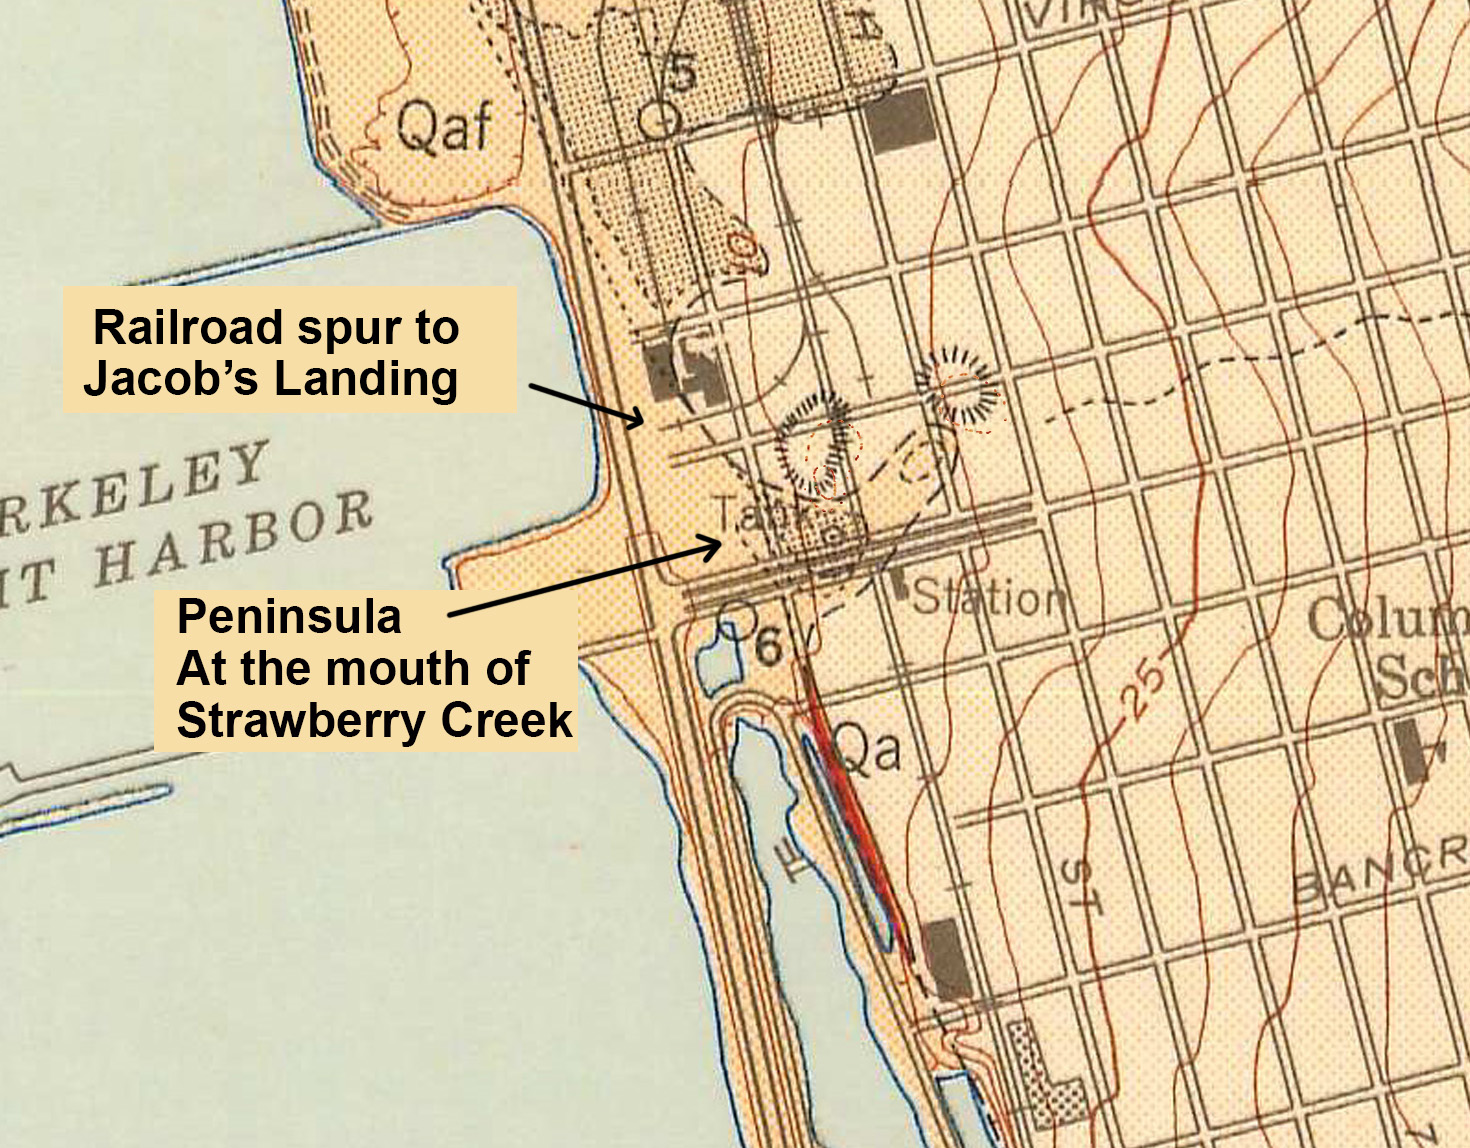
- Recognizable landmarks, specifically, Jacob’s Landing and Railroad Spur and the small peninsula comprised of alluvial deposition that had built up at the mouth of Strawberry Creek.
Triangulation stations
The U.S. Coast Survey map makers used recognizable high points and monuments in the landscape as Surveying Stations for use as a base for triangulating positions and distances. These base stations were measured against each other to create higher degrees of accuracy.
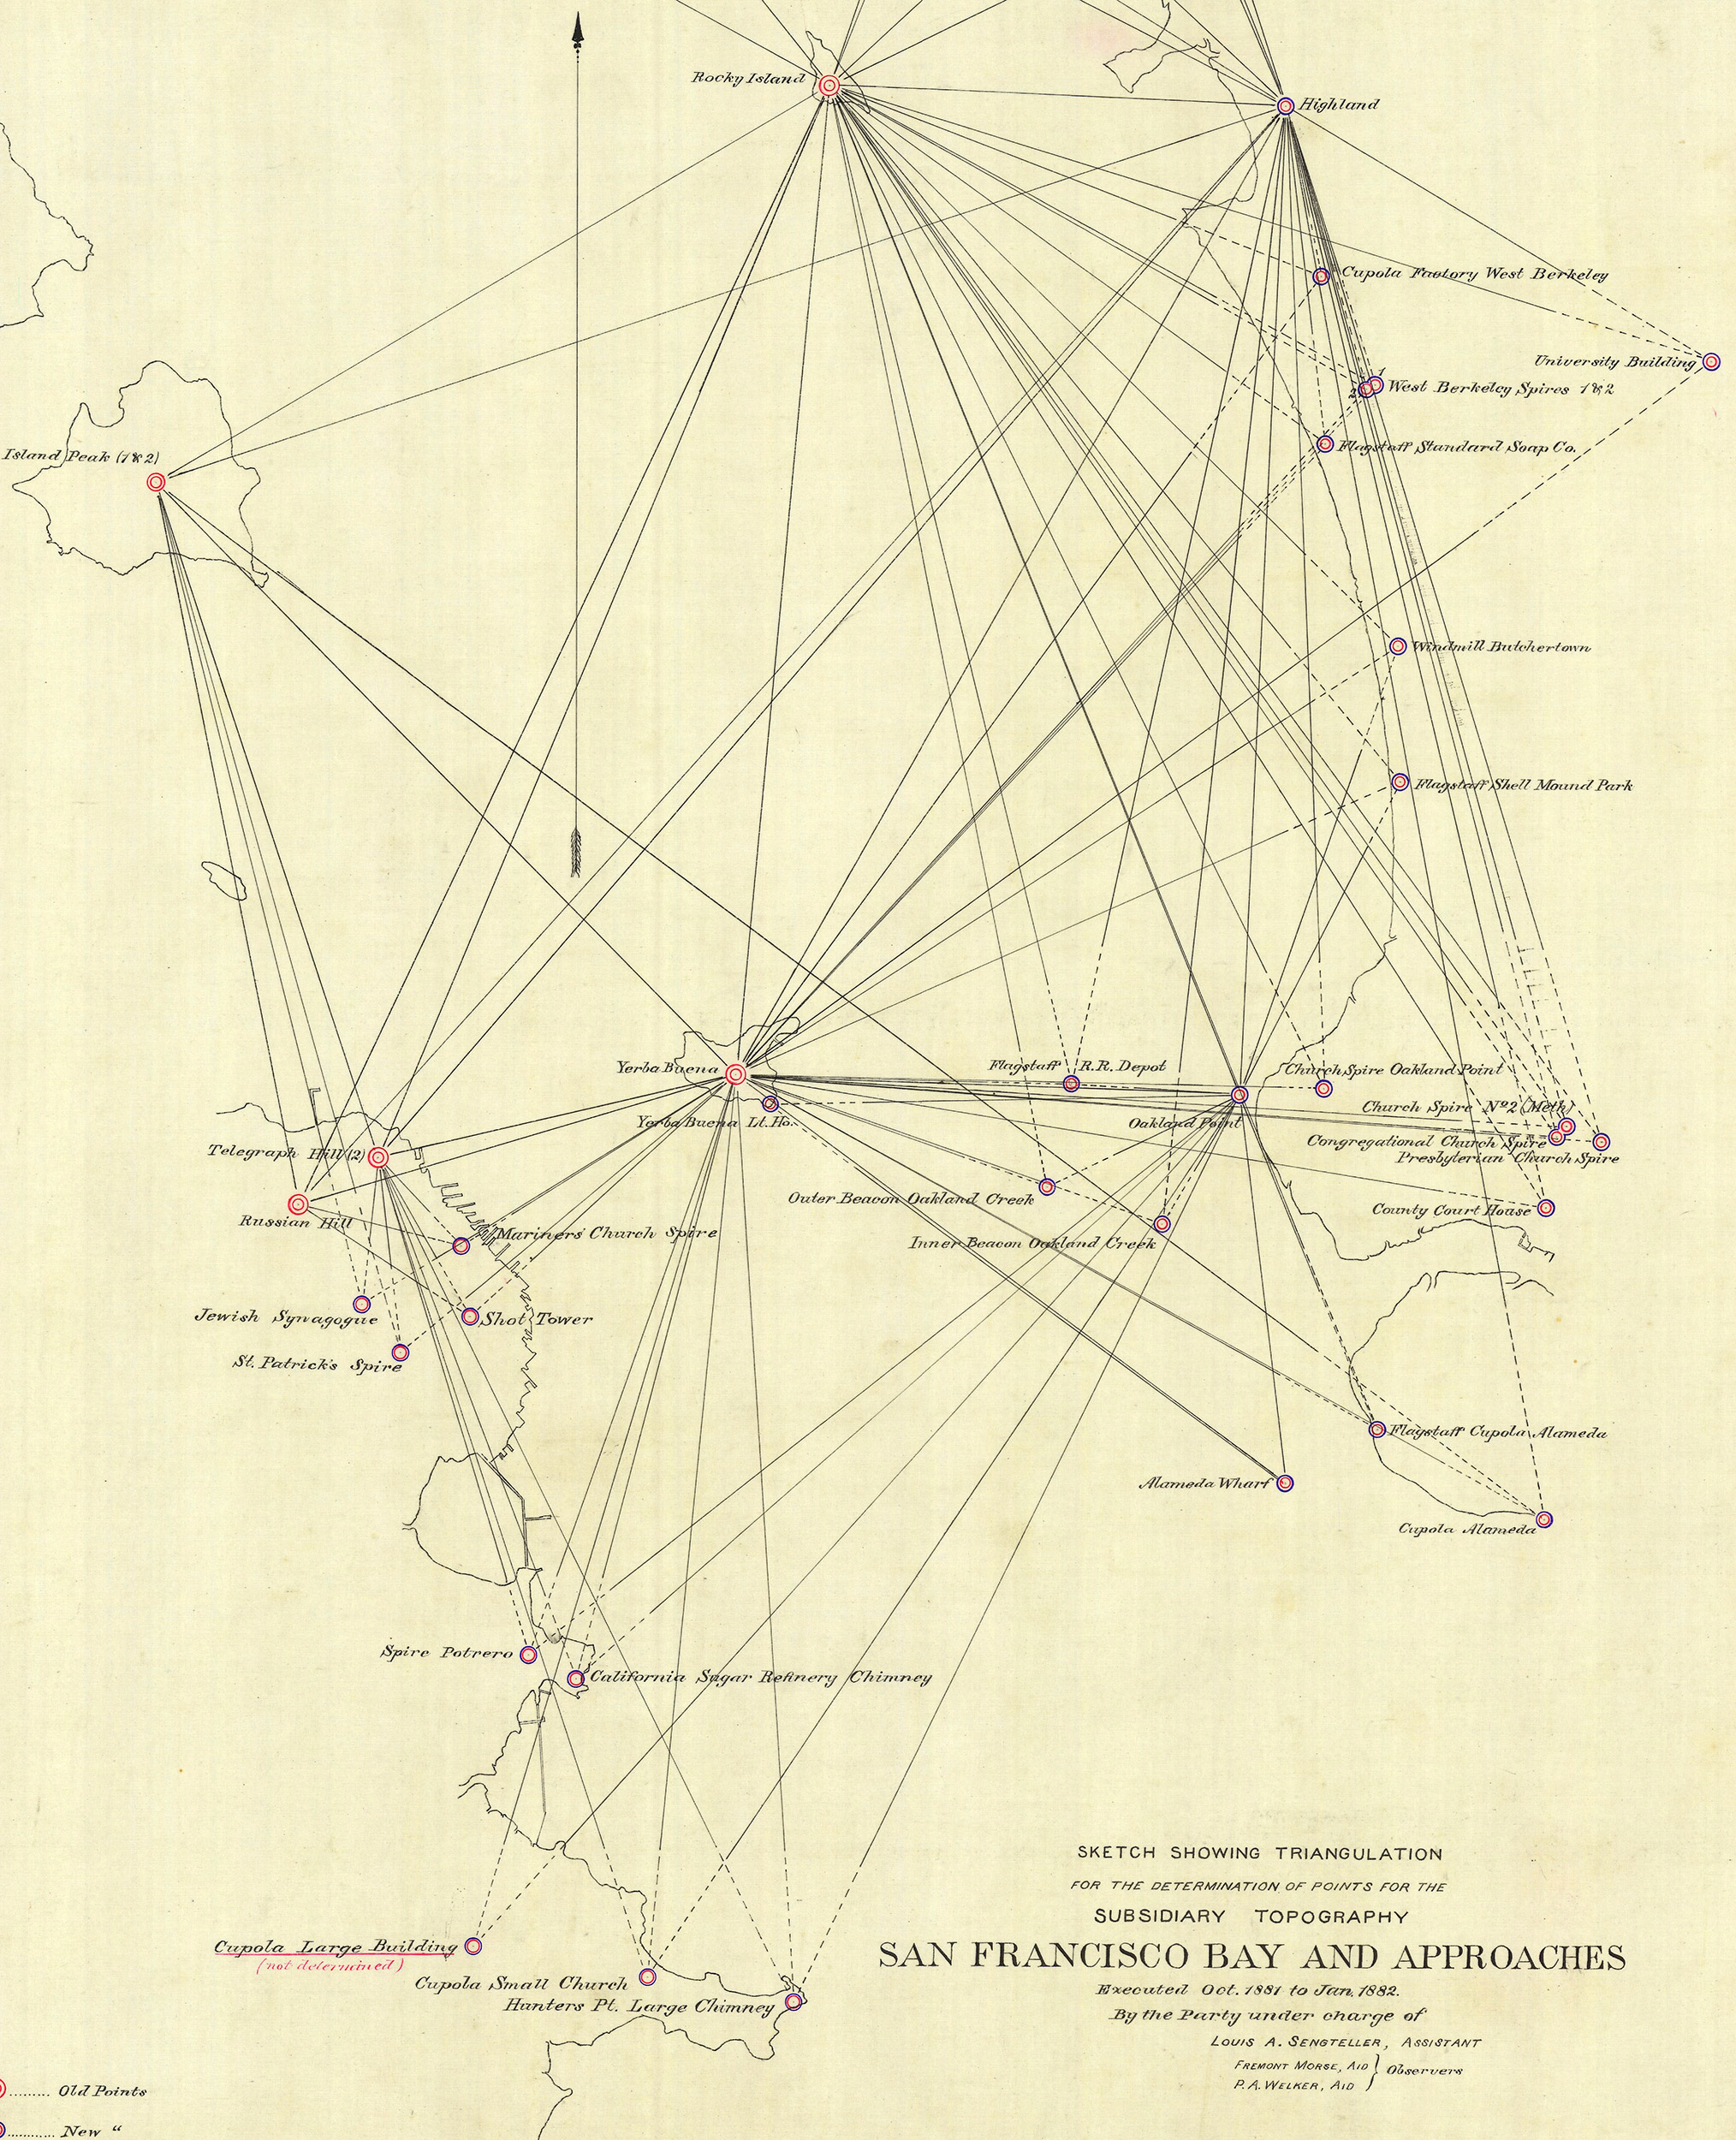

The triangulation map above was created in 1882, at a time when surveyors were using prominent industrial features such as spires and smokestacks as well as geographic features, such as the top of Yerba Buena Island, as reference points for their trigonometric calculations.
The accuracy of these early coast surveys is comparable to modern mapping techniques. As quoted in Triangulating Archeological Landscapes by Scott Byram (page 17): “The triangulation from the Pulgas Base (35 miles south of San Francisco) to the Yolo base exceeded its true length by .35 meters, a difference which is equivalent to about 1/50,0000 of the actual length.”
In other words, a measurement between the two bases was so accurate that it was only off by one foot across 10 miles.
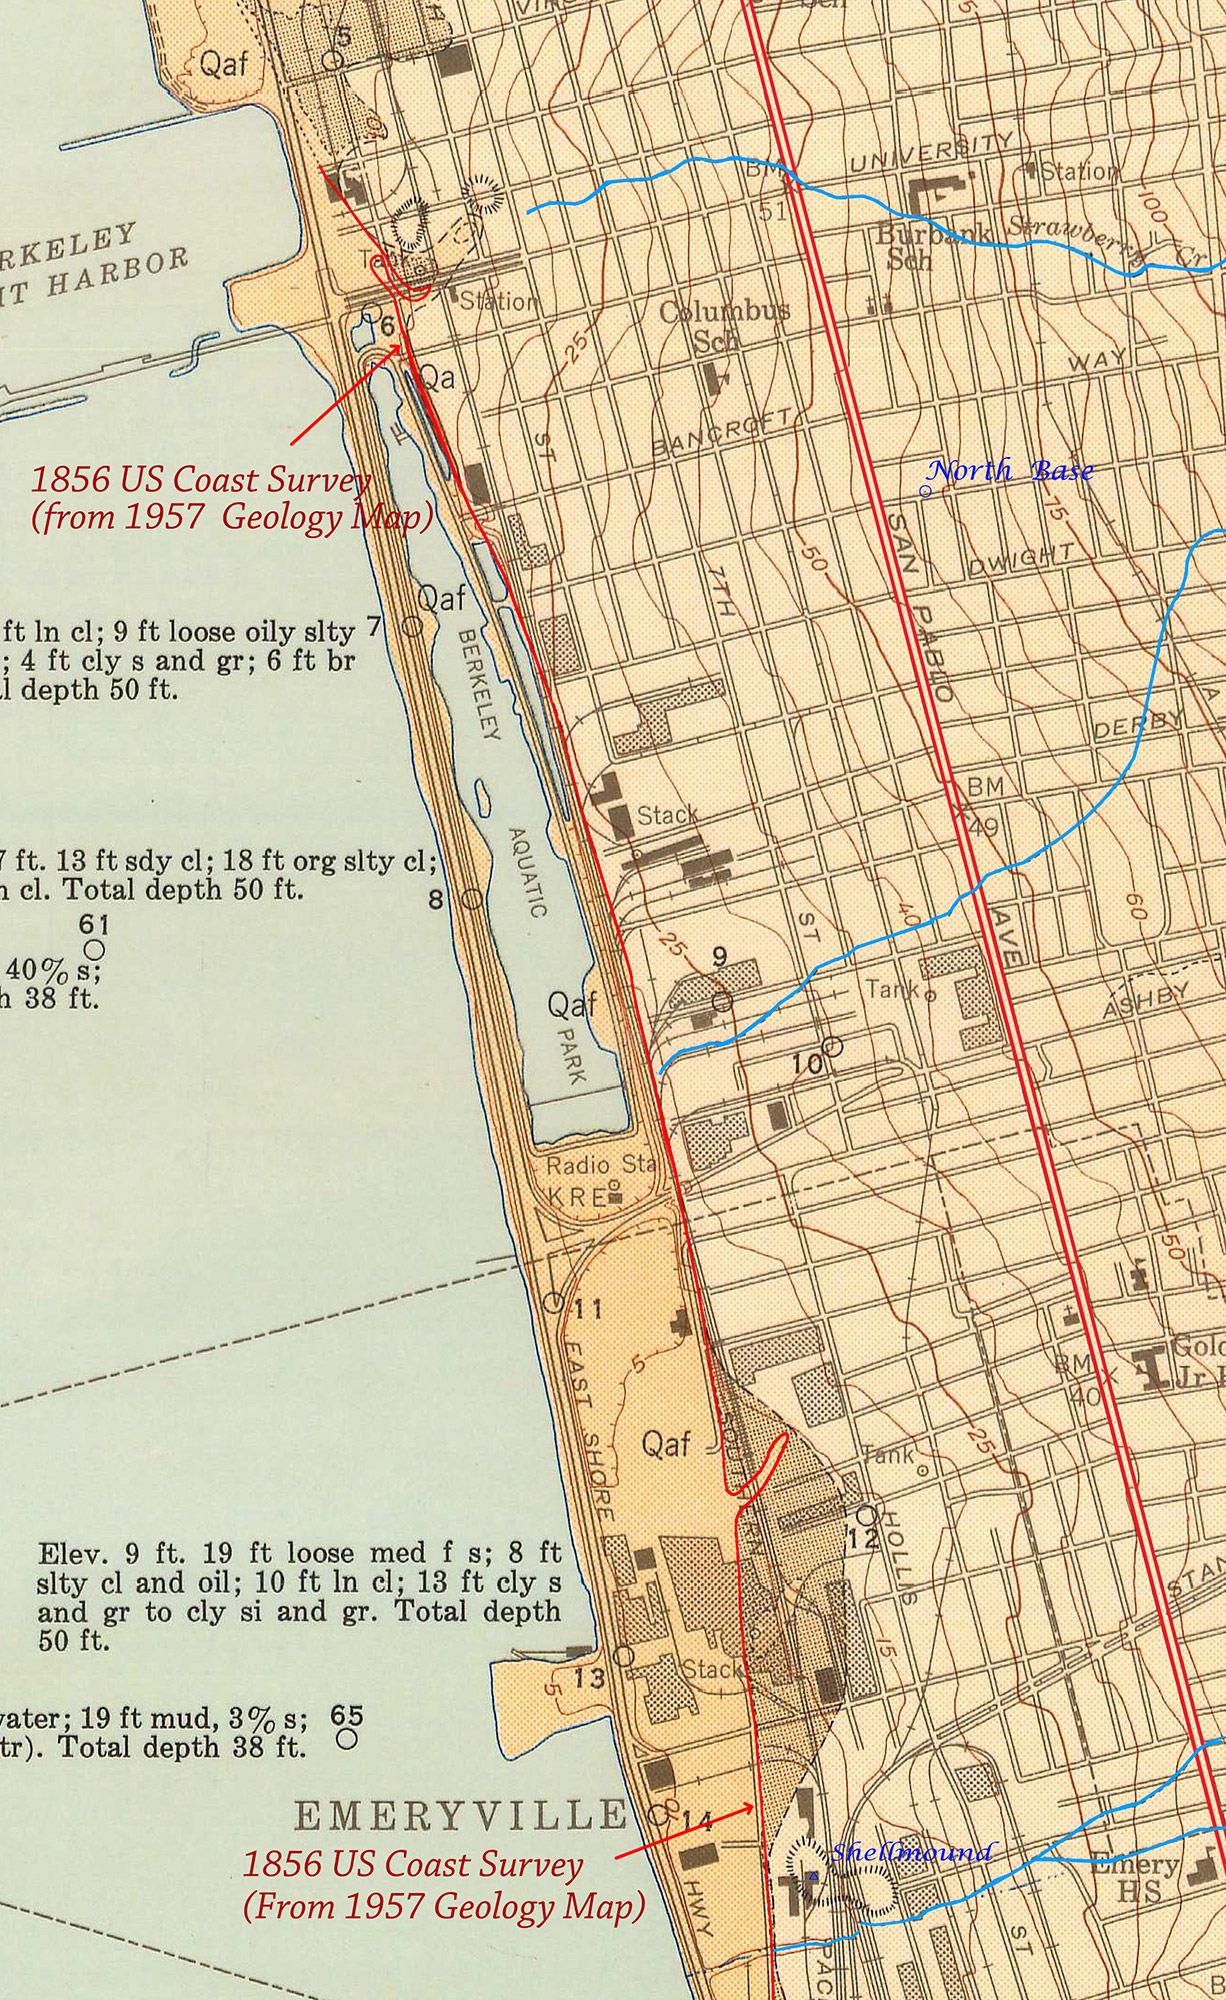
The following map shows the 1957 Geological Survey (the Developer’s exhibit) with the 1856 T-sheet registered at 50% transparency, and close-ups of the four base stations used as landmarks:

The Coast, Creeks and Roads
The 1957 U.S. Geology Survey with geographic landmarks highlighted (coast line, creeks, San Pablo Ave.):
Landmarks from the 1957 Geological Survey superimposed on the original 1856 map:

Areas of coincidence between the 1957 US Geological Survey map and the original 1856 Coast Survey map highlighted in pink:

Recognizable Landmarks
Two key local landmarks are corroborated on multiple maps— the peninsula at the mouth of Strawberry Creek and Jacob’s Landing. Here are four maps with prominent landmarks for registration:

We can now systematically create a contemporary map with a more precise Shellmound footprint.
We start with the 1957 U. S. Geological Survey map with local landmarks annotated:
The 1957 Geological Survey with its own overlay of the 1856 map’s Coastline (red) and Strawberry Creek (blue) highlighted:
The original 1856 US Coast Survey, superimposed and registered on to the 1957 U.S Geological Survey map:

Note that Jacob’s Landing, the Coastline, Strawberry Creek, and the peninsula at the mouth of Strawberry Creek, are all lining up.
Shellmounds from the original 1856 US Coast survey highlighted:

Spenger’s parking lot and street grid from the 1957 Geological survey highlighted in red. Landmarks used for registration are pink:
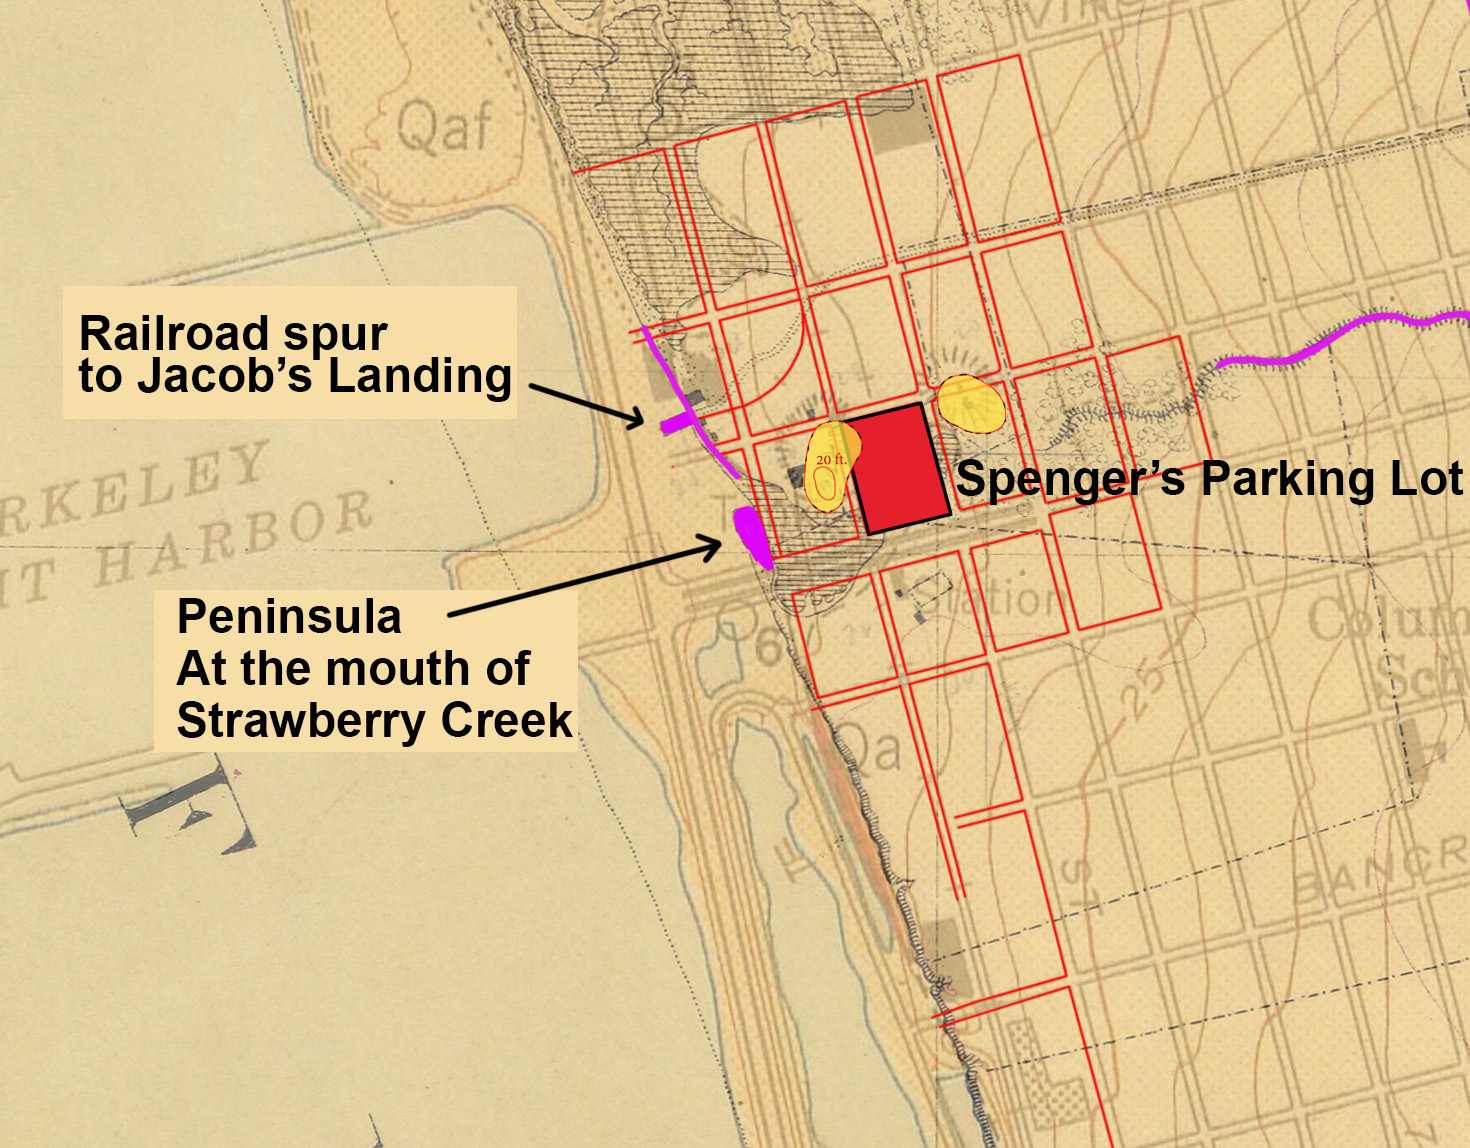
With contemporary streets we can now see how the Berkeley City landmark and historical resource boundaries are embracing the shellmound footprints. The Spenger’s parking lot is at the center of one of the most valuable historical resources in the state of California. And the 1856 Coast Survey re-inserted into the 1957 USGS map shows that the western shellmound is overlapping the Spenger’s parking lot in the northwest corner.
 Based on the research above, we know that the US Coast Survey team utilized the most accurate mapping techniques of its time. And that the accuracy they achieved is comparable to modern mapmaking. We also know that the local landmarks used for alignment were stable for at least 30 years.
Lastly, we owe a debt of gratitude to David Kerr, the surveyor who drew the 1856 T- sheet, who lovingly set out to document the West Berkeley Shellmound and ecosystem. The accuracy of the shape of the mounds and the 20-foot topo line speaks for itself.